
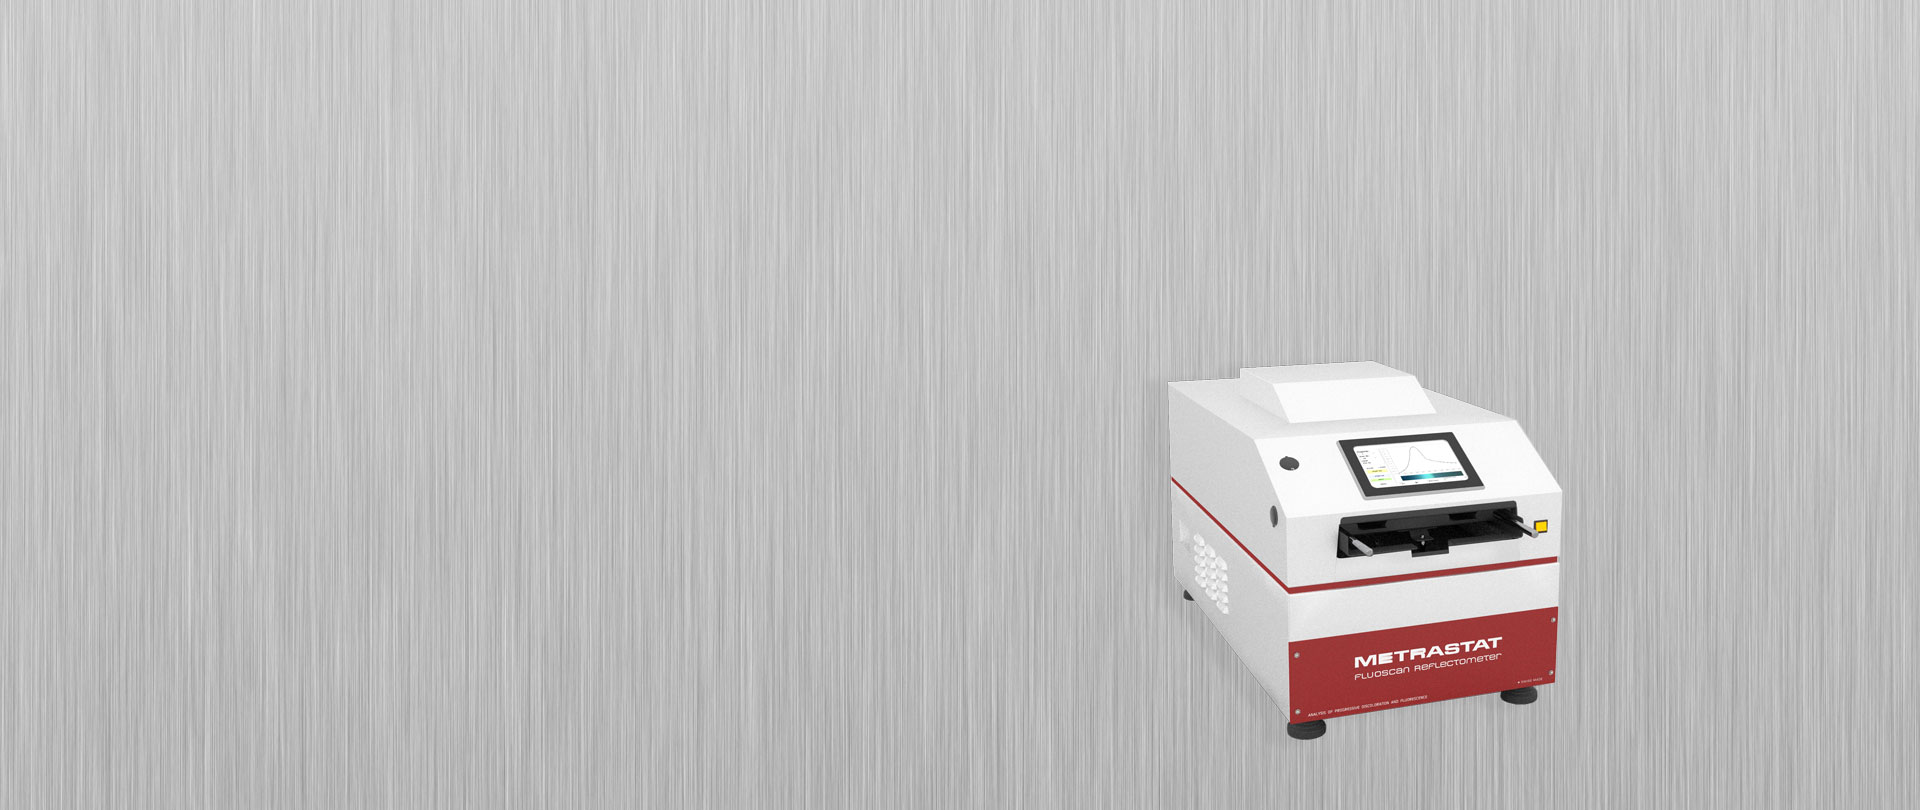
If you now wish to evaluate quantitatively the progressive color changes observed on samples emerging from a METRASTAT PLC TOUCH testing oven, our automatic scanning FLUOSCAN REFLECTOMETER will do it for you, fast, with precision and reproducibility.
In its fluorescence mode, the reflectometer reveals an increase in the concentration of short chain unsaturations in the polymer and so, an increase of stabilizer consumption during exposure to heat. This phenomenon, otherwise invisible to observation under day light with the naked eye, applies to halogenated polymers such as PVC, PVDF, etc. but also to other polymers undergoing thermal degradation by auto-oxydation such as PE, PP, PA, etc. All data collected by the reflectometer is processed and stored on the dedicated computer of the instrument and can be exported in Excel format, or printed directly.
OPERATING PRINCIPLE
The double track scanning reflectometer for the evaluation of either the progressive color change or the fluorescence intensity of polymer samples previously exposed to heat in either a METRASTAT testing oven or any other similar equipment operating according to the principle of an incremental motion of test samples emerging from a heating enclosure kept at a constant temperature.
Two detector heads, both connected to a spectrophotometer, operate separately in two distinct modes of illumination of the samples, one in white light, the other in UV light.
In either one of these two modes, the reflectometer generates, on its touch screen, a calibrated scaled image of the sample showing any change in color or fluorescence occurring in the sample during the scanning operation after exposure to heat.
Precise and reproducible information on the color composition of the sample is then given in all three coördinates of the CIE L*a*b* color space in the form of images, tables or curves, on screen or in an exportable format.
The following curves, representative of color trends and other useful variables can hence be easily generated by the instrument.
-
L* Lightness Curve
-
a* (>0) Reddening Curve
-
a* (<0) Greening Curve
-
b* (>0) Yellowing Curve
-
b* (<0) Bluing Curve
-
YI Yellowness Index (ASTM D1925)
| Power supply | 185-245VAC/48-62Hz |
| Maximum power uptake | 200W |
| Number of tracks | 2 |
| White light illuminant | D65 (LED) |
| UV light illuminant | 365nm (LED) |
| Number and size of samples | 2 x (260 x 35 x 6mm) |
| Warm-up time | Automatic |
| Run duration | 1 to 2 min |
| Dimensions (WxHxD) | 79 x 45 x 54cm |
| Weight | 63 kg |